python
simple
from diagrams import Diagram
from diagrams.aws.compute import EC2

with Diagram("Simple Diagram",
             filename='images/simple_diagram',
             ):
    EC2("web")

# return filename to org-mode
return 'images/simple_diagram.png'

aws event processing aws
#!/usr/bin/env python3
# coding=utf-8
# vim:ts=4:sts=4:sw=4:et
#
# Author: Hari Sekhon
# Date: 2023-04-14 13:54:52 +0100 (Fri, 14 Apr 2023)
#
# https://github.com/HariSekhon/Diagrams-as-Code
#
# License: see accompanying Hari Sekhon LICENSE file
#
# If you're using my code you're welcome to connect with me on LinkedIn
# and optionally send me feedback to help steer this or other code I publish
#
# https://www.linkedin.com/in/HariSekhon
#
"""
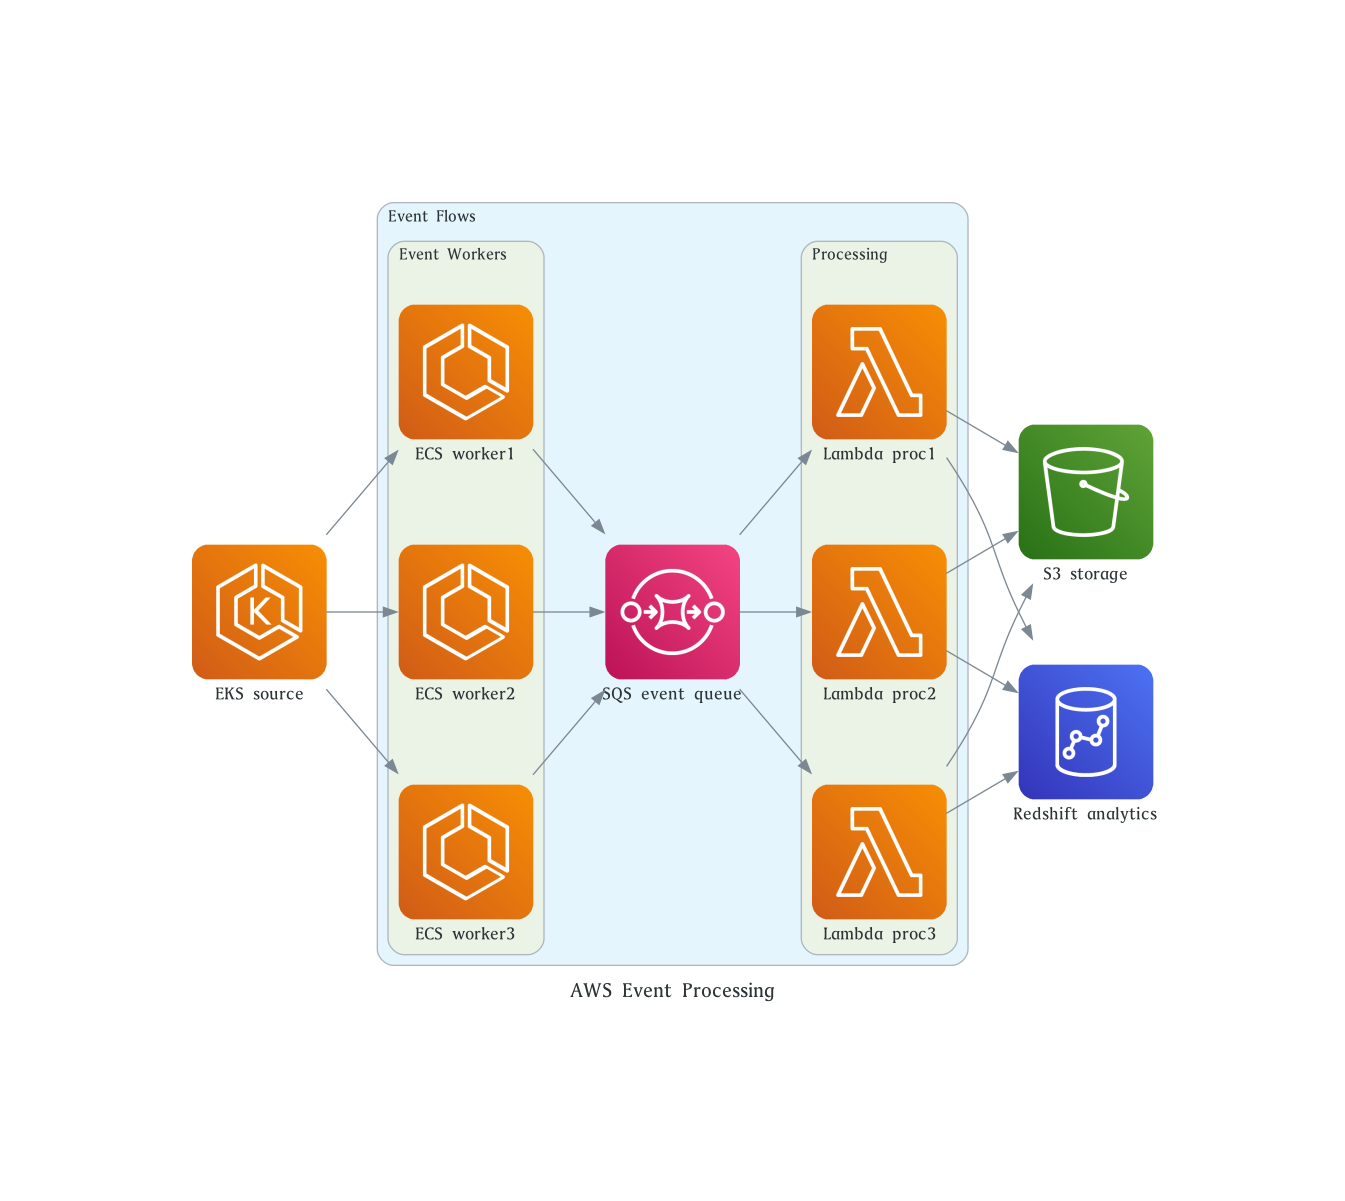
AWS Event Processing
"""
# based on https://diagrams.mingrammer.com/docs/getting-started/examples
__author__ = 'Hari Sekhon'
__version__ = '0.2'
import os
from diagrams import Diagram, Cluster
# ============================================================================ #
# AWS resources:
#
# https://diagrams.mingrammer.com/docs/nodes/aws
#
from diagrams.aws.compute import ECS, EKS, Lambda
from diagrams.aws.database import Redshift
from diagrams.aws.integration import SQS
from diagrams.aws.storage import S3
graph_attr = {
"splines": "spline",
}
# Nest clusters
with Diagram("AWS Event Processing",
show=not bool(os.environ.get('CI', 0)),
filename='images/aws_event_processing',
graph_attr=graph_attr,
):
eks = EKS("EKS source")
with Cluster("Event Flows"):
with Cluster("Event Workers"):
workers = [ECS("ECS worker1"),
ECS("ECS worker2"),
ECS("ECS worker3")]
queue = SQS("SQS event queue")
with Cluster("Processing"):
lambdas = [Lambda("Lambda proc2"), # middle
Lambda("Lambda proc3"), # puts below
Lambda("Lambda proc1")] # puts last one above
# this is why it's ordered weirdly here but comes out ordered in diagram
s3 = S3("S3 storage")
redshift = Redshift("Redshift analytics")
# pylint: disable=W0104
eks >> workers >> queue >> lambdas
lambdas >> s3
lambdas >> redshift
return "images/aws_event_processing.png"